Download the alternative format
(Word format, 7 pages, 114KB)
Preliminary information and subject to change throughout the day
Case study: [2020-060] Multi-provincial outbreak of Salmonella Newport
Cluster Code: 2005NEWWGS-1ON-MP
Epidemiologic Update, June 1, 2020 as of 11:00 EDT
|
|
Confirmed cases (n=14) |
|
P/T Case Count |
QC=1 |
|
Estimated Burden of Illness[1] |
365 |
|
Age (years) |
32.0 |
|
Sex: % Female |
79% (11/14) |
|
Hospitalizations |
0 |
|
Deaths |
0 |
|
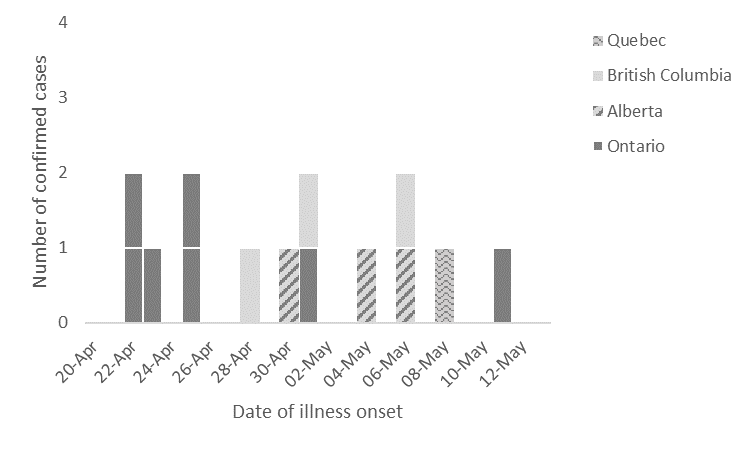
Onset date range |
April 22, 2020 – May 11, 2020 |
|
Reporting Delay (days) Median |
22 |
|
Epidemic curve |
S. Newport cases by symptom onset and province (n=14) |
UPDATES
Epidemiological:
- Exposure information is available for 7/14 cases
- 7/14 cases have been re-interviewed by PHAC-OMD using the hypothesis-generating questionnaire ( ON=5, BC=2)
- 3/14 cases are lost to follow up
- 4/14 cases are pending re-interview
- The following foods were reported in higher than expected frequencies during re-interviews (See Appendix B):
- Spinach
- 4/5 (80%) report exposure to spinach
- 4 report baby spinach
- 3 report purchasing brand X in a plastic container from Grocery Store Chain 1
- 1 reports purchasing brand Y in a plastic bag from Grocery Store Chain 2
- Blueberries
- 5/7 (71%) report exposure to blueberries
- 1 reports purchasing from Grocery Store Chain 1
- 1 reports purchasing from local independent grocery store
- 1 reports purchasing from a Farmer’s Market
- Nuts & Seeds
- 4/6 (67%) report exposure to walnuts
- 1 reports purchasing from Grocery Store Chain 1
- 5/6 (83%) report exposure to almonds
- 1 reports purchasing from Grocery Store Chain 2
- 1 reports “Plain and Simple” brand
- 4/6 (67%) report exposure to sesame seeds
- 1 reports purchasing from Grocery Store Chain 2
- 5/7 (71%) report exposure to chia seeds
- 1 reports purchasing from local independent grocery store
- 4/6 (67%) report exposure to flax seeds
- 4/6 (67%) report exposure to walnuts
- 5/7 (71%) report exposure to blueberries
- 4/5 (80%) report exposure to spinach
- Spinach
Laboratory:
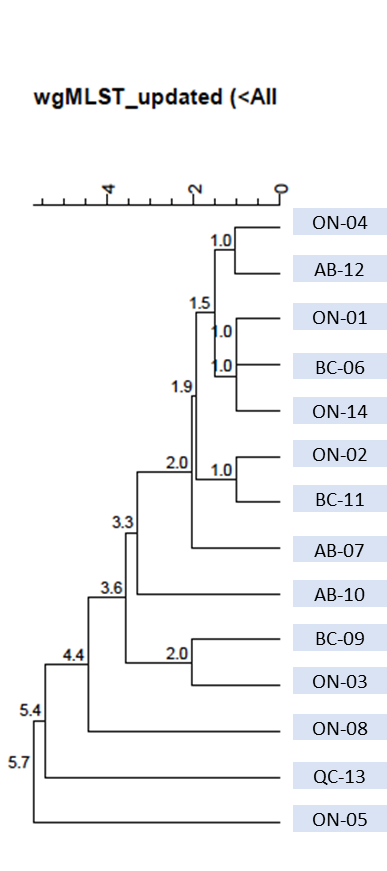
- All confirmed cases are related by 0-6 wgMLST allele differences (See Appendix C).
- This cluster of cases is within 0-25 alleles of a historic cluster of four Ontario cases from 2019 (1908NEWWGS-1ON). The onset dates for this cluster ranged from August 8, 2019 to September 2, 2019. The source of this outbreak was never confirmed, although some type of nut or seed product was suspected. PulseNet Canada confirms that this cluster is not within 25 alleles of any non-clinical isolates.
Food Safety:
- CFIA has begun traceback activities for the spinach reported by four cases that all purchased their spinach from the same grocery chain to determine where the baby spinach was sourced from.
Communications:
- A Public Health Alert (PHA) was posted to CNPHI on May 25, 2020.
Appendix A: Case Definitions
Confirmed case:
A resident of or visitor to Canada with:
- Laboratory confirmation of Salmonella Newport AND
- Isolate matching PulseNet Canada cluster 2005NEWWGS-1ON-MP by whole genome sequencing* AND
- Symptom onset or laboratory confirmation on or after April 1, 2020
*Guidelines for whole genome sequencing interpretation are determined by the Public Health Agency of Canada’s National Microbiology Laboratory.
Appendix B – Food exposure frequencies of confirmed cases compared to Foodbook Canada reference values (n=7).
|
Food Item |
Confirmed Cases |
Reference |
Binomial Probability |
||||
|
Yes |
Prob |
No |
DK |
%Y+P |
Foodbook Canada* |
p-value |
|
|
MEATS |
|||||||
|
Any chicken (not including deli meat) |
3 |
0 |
3 |
1 |
50.0 |
85.6 |
0.0375 |
|
Any pork (not including deli meat) |
1 |
2 |
3 |
1 |
50.0 |
55.1 |
0.3028 |
|
Any beef (not including deli meat) |
1 |
1 |
4 |
1 |
33.3 |
78.4 |
0.0201 |
|
EGGS |
|||||||
|
Any eggs |
2 |
3 |
2 |
0 |
71.4 |
80.7 |
0.2677 |
|
DAIRY PRODUCTS |
|||||||
|
Any dairy (excluding cheese) |
3 |
1 |
3 |
0 |
57.1 |
84.6 |
0.0655 |
|
Non-dairy milk |
3 |
0 |
3 |
1 |
50.0 |
No data |
No data |
|
Any cheese |
4 |
0 |
3 |
0 |
57.1 |
88.8 |
0.00306 |
|
VEGETABLES |
|||||||
|
Tomatoes |
3 |
1 |
3 |
0 |
57.1 |
72.9 |
0.1967 |
|
Any lettuce or leafy greens |
4 |
1 |
1 |
1 |
83.3 |
82.4 |
0.4011 |
|
Iceberg |
0 |
2 |
3 |
2 |
40.0 |
41.1 |
0.3452 |
|
Romaine |
2 |
1 |
3 |
1 |
50.0 |
48.8 |
0.312 |
|
Spinach |
4 |
0 |
1 |
2 |
80.0 |
28.4 |
0.0233 |
|
Sprouts |
2 |
1 |
4 |
0 |
42.9 |
12.9 |
0.0432 |
|
Cucumbers |
3 |
2 |
2 |
0 |
71.4 |
62.9 |
0.2846 |
|
Bell peppers |
4 |
0 |
2 |
1 |
66.7 |
63.6 |
0.3252 |
|
Broccoli |
3 |
0 |
3 |
1 |
50.0 |
55.5 |
0.3013 |
|
Cauliflower |
4 |
0 |
3 |
0 |
57.1 |
33.0 |
0.1248 |
|
Mushrooms |
4 |
0 |
3 |
0 |
57.1 |
50.0 |
0.2734 |
|
Zucchini |
3 |
1 |
3 |
0 |
57.1 |
21.1 |
0.0341 |
|
FRUITS |
|||||||
|
Melons |
3 |
0 |
3 |
1 |
50.0 |
39.7 |
0.2744 |
|
Apples |
4 |
1 |
2 |
0 |
71.4 |
72.3 |
0.3183 |
|
Bananas |
4 |
2 |
1 |
0 |
85.7 |
76.7 |
0.3321 |
|
Citrus fruits |
4 |
0 |
3 |
0 |
57.1 |
65.0 |
0.2679 |
|
Any berries |
5 |
0 |
2 |
0 |
71.4 |
65.2 |
0.2997 |
|
Strawberries |
2 |
2 |
2 |
1 |
66.7 |
49.6 |
0.2306 |
|
Raspberries |
2 |
0 |
3 |
2 |
40.0 |
27.5 |
0.2882 |
|
Blueberries |
3 |
2 |
2 |
0 |
71.4 |
31.3 |
0.0298 |
|
Blackberries |
3 |
1 |
3 |
0 |
57.1 |
10.5 |
0.003 |
|
Mangoes |
4 |
0 |
3 |
0 |
57.1 |
15.7 |
0.0127 |
|
Pineapple |
1 |
1 |
5 |
0 |
28.6 |
30.0 |
0.3177 |
|
NUTS & SEEDS |
|||||||
|
Peanuts |
4 |
0 |
3 |
0 |
57.1 |
33.6 |
0.1306 |
|
Almonds |
2 |
3 |
1 |
1 |
83.3 |
41.0 |
0.041 |
|
Walnuts |
3 |
1 |
2 |
1 |
66.7 |
18.5 |
0.0117 |
|
Hazelnuts (filberts) |
0 |
0 |
6 |
1 |
0.0 |
10.1 |
0.5279 |
|
Cashews |
2 |
0 |
1 |
4 |
66.7 |
26.8 |
0.1577 |
|
Pecans |
2 |
1 |
3 |
1 |
50.0 |
12.9 |
0.0284 |
|
Pistachios |
0 |
0 |
4 |
3 |
0.0 |
No data |
No data |
|
Other nuts |
1 |
0 |
3 |
3 |
25.0 |
No data |
No data |
|
Peanut butter |
4 |
0 |
3 |
0 |
57.1 |
55.0 |
0.2918 |
|
Other nut butters/pastes/spreads |
2 |
1 |
3 |
1 |
50.0 |
18.3 |
0.0668 |
|
Sunflower seeds |
2 |
1 |
3 |
1 |
50.0 |
18.3 |
0.0668 |
|
Sesame seeds |
2 |
2 |
2 |
1 |
66.7 |
17.1 |
0.0088 |
|
Chia seeds |
3 |
2 |
2 |
0 |
71.4 |
No data |
No data |
|
Flax seeds |
2 |
2 |
2 |
1 |
66.7 |
No data |
No data |
|
Other seeds |
1 |
0 |
3 |
3 |
25.0 |
No data |
No data |
|
OTHER |
|||||||
|
Cold cereals |
2 |
0 |
4 |
1 |
33.3 |
54.3 |
0.1929 |
|
Hot cereals |
2 |
0 |
2 |
3 |
50.0 |
28.5 |
0.2491 |
|
Vegetarian/Vegan |
2 |
0 |
3 |
2 |
40.0 |
No data |
No data |
|
Supplements |
3 |
0 |
4 |
0 |
42.9 |
28.2 |
0.2086 |
*Canada. Infectious Disease Prevention and Control Branch. Foodbook Report. Guelph: Public Health Agency of Canada; 2015.

Appendix C: wgMLST Analysis for event 2020-060 (cluster code 2005NEWWGS-1ON-MP )
Text description: WGS analysis illustrating genetic relatedness of 14 cases. Cases are all genetically related by 0-5.7 wgMLST allele differences.
[1] Based on multiplier for Salmonella (26.1) obtained from Thomas MK, Murray R, Flockhart L, et al. Estimates of the burden of foodborne illness in Canada for 30 specified pathogens and unspecified agents, Circa 2006. Foodborne Pathog Dis 2013;10(7):639-648.

